2025 Season
Print
Info
Touch/click a team to view more results and analysis
Winter League Competition is ranked on games won plus 2 point match win bonus or 1 point draw bonus
Summer League Competition is ranked on games won plus 1 point match win bonus
Winter League Competition
Matches
Pts
P
W
L
D
H
A
Games
Pts
P
W
L
H
A
On The Piste
39
6
5
0
1
2
3
408
36
28
8
14
14
Win Performance
All Games
78%
Home Games
78%
Away Games
78%
Singles
78%
Doubles
75%
Triples
83%
Other Fun Facts
Average Points per Game: 11.3
Close Calls. Games lost 12-13: 0
Mistle-Throw & Wine
24
6
2
2
2
1
1
383
36
18
18
9
9
Win Performance
All Games
50%
Home Games
50%
Away Games
50%
Singles
44%
Doubles
58%
Triples
50%
Other Fun Facts
Average Points per Game: 10.6
Close Calls. Games lost 12-13: 2
Point Setters
24
6
3
2
1
1
2
366
36
17
19
9
8
Win Performance
All Games
47%
Home Games
50%
Away Games
44%
Singles
33%
Doubles
58%
Triples
67%
Other Fun Facts
Average Points per Game: 10.2
Close Calls. Games lost 12-13: 4
Raging Boules
24
6
2
2
2
1
1
356
36
18
18
9
9
Win Performance
All Games
50%
Home Games
50%
Away Games
50%
Singles
50%
Doubles
58%
Triples
33%
Other Fun Facts
Average Points per Game: 9.9
Close Calls. Games lost 12-13: 2
Boules Of Fury
18
6
1
3
2
1
0
333
36
14
22
7
7
Win Performance
All Games
39%
Home Games
39%
Away Games
39%
Singles
44%
Doubles
33%
Triples
33%
Other Fun Facts
Average Points per Game: 9.3
Close Calls. Games lost 12-13: 3
Bah Humbugs
15
6
1
5
0
1
0
328
36
13
23
7
6
Win Performance
All Games
36%
Home Games
39%
Away Games
33%
Singles
50%
Doubles
17%
Triples
33%
Other Fun Facts
Average Points per Game: 9.1
Close Calls. Games lost 12-13: 1
Summer League Competition
Matches
Pts
P
W
L
D
H
A
Games
Pts
P
W
L
H
A
North Buckden Badgers
118
15
14
1
0
7
7
1603
135
104
31
50
54
Win Performance
All Games
77%
Home Games
79%
Away Games
75%
Singles
72%
Doubles
84%
Triples
77%
Other Fun Facts
Average Points per Game: 11.9
Close Calls. Games lost 12-13: 5
Crown
93
15
10
5
0
7
3
1438
135
83
52
50
33
Win Performance
All Games
61%
Home Games
69%
Away Games
52%
Singles
67%
Doubles
56%
Triples
60%
Other Fun Facts
Average Points per Game: 10.7
Close Calls. Games lost 12-13: 3
Barley Mow
78
15
10
5
0
4
6
1386
135
68
67
28
40
Win Performance
All Games
50%
Home Games
44%
Away Games
56%
Singles
45%
Doubles
53%
Triples
57%
Other Fun Facts
Average Points per Game: 10.3
Close Calls. Games lost 12-13: 12
Anchor
66
15
6
9
0
2
4
1259
135
60
75
29
31
Win Performance
All Games
44%
Home Games
40%
Away Games
49%
Singles
45%
Doubles
42%
Triples
47%
Other Fun Facts
Average Points per Game: 9.3
Close Calls. Games lost 12-13: 5
Bell Ringers
49
15
4
11
0
3
1
1167
135
45
90
27
18
Win Performance
All Games
33%
Home Games
38%
Away Games
29%
Singles
38%
Doubles
27%
Triples
33%
Other Fun Facts
Average Points per Game: 8.6
Close Calls. Games lost 12-13: 12
Bell
46
15
1
14
0
0
1
1118
135
45
90
21
24
Win Performance
All Games
33%
Home Games
33%
Away Games
33%
Singles
33%
Doubles
38%
Triples
27%
Other Fun Facts
Average Points per Game: 8.3
Close Calls. Games lost 12-13: 5
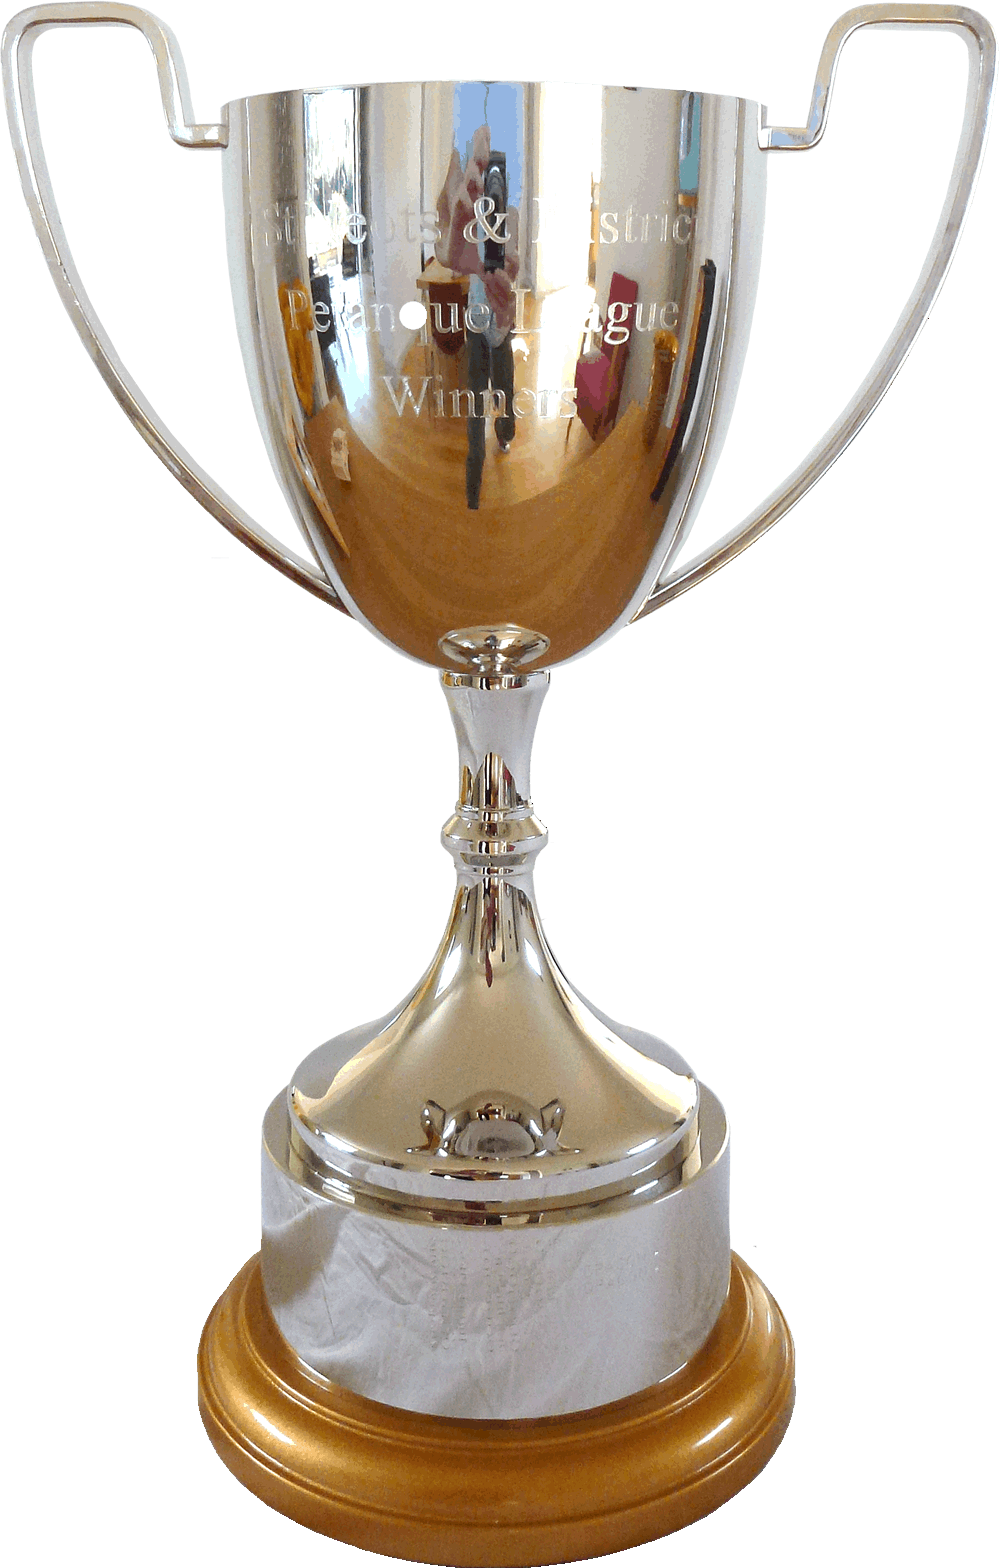 Summer League Winners Trophy
WINNER
North Buckden Badgers
 Past Players Memorial Trophy
WINNER
Anchor
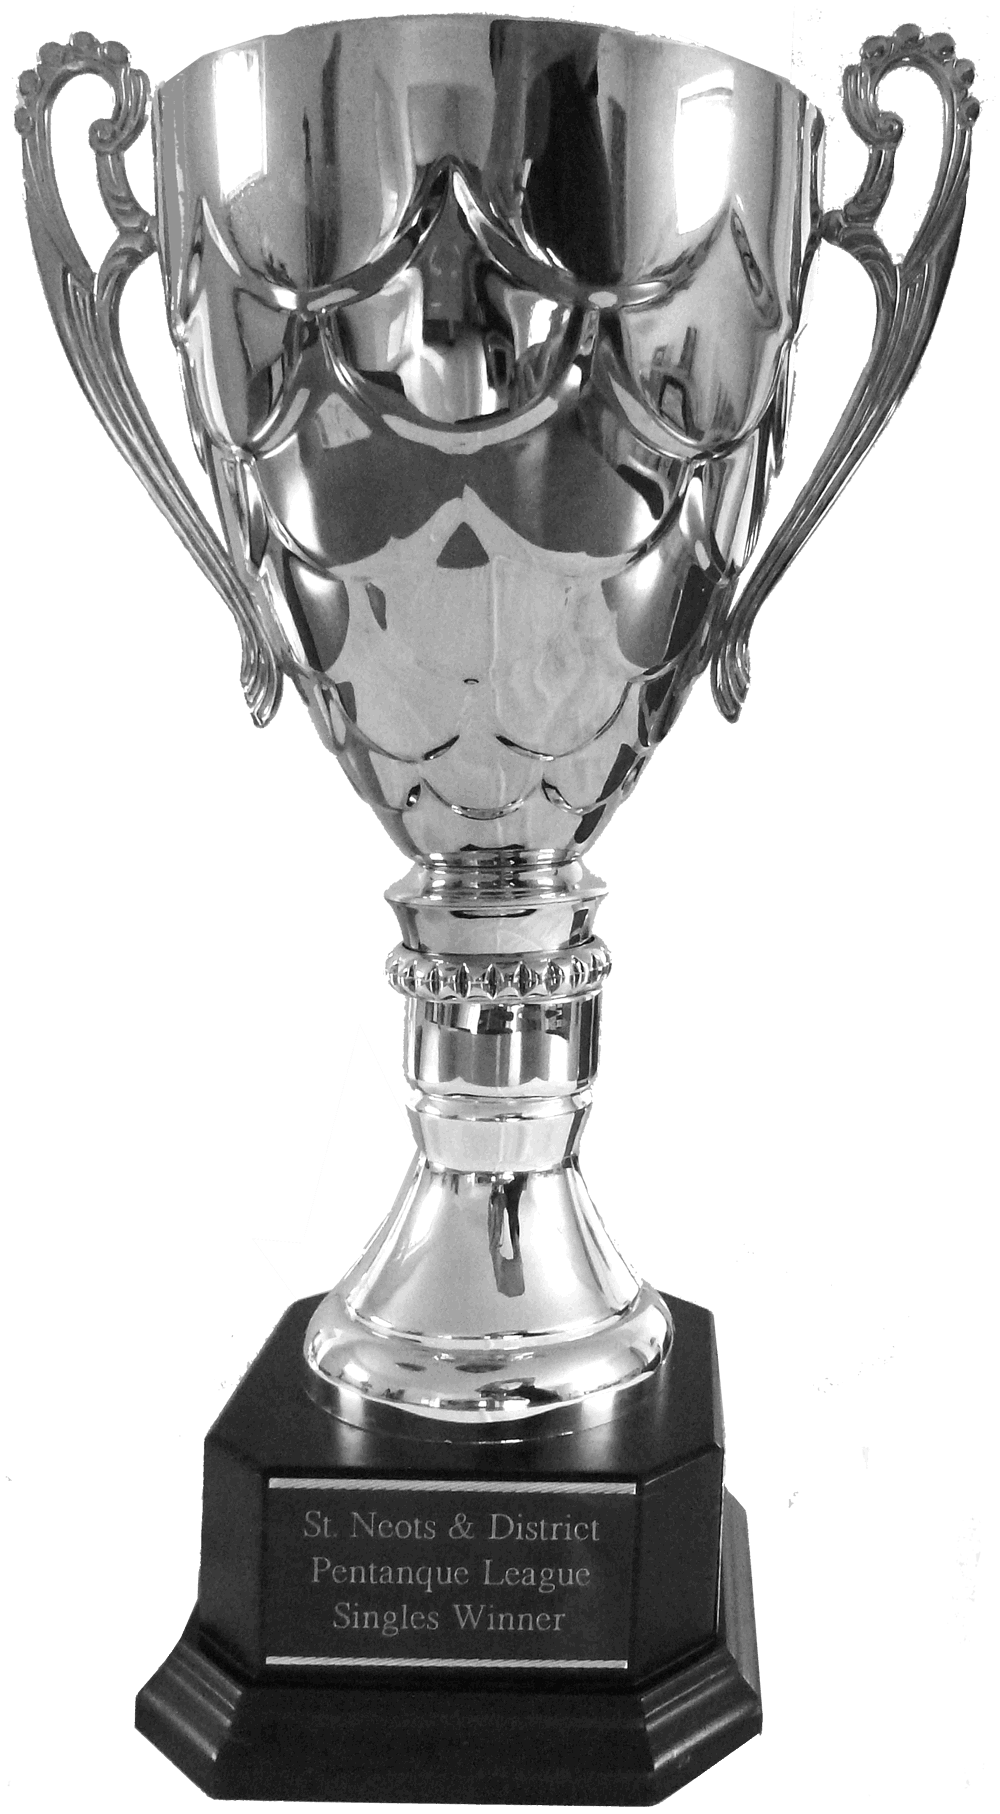 Singles Knockout Trophy

WINNER
Neil Stubbs
Crown
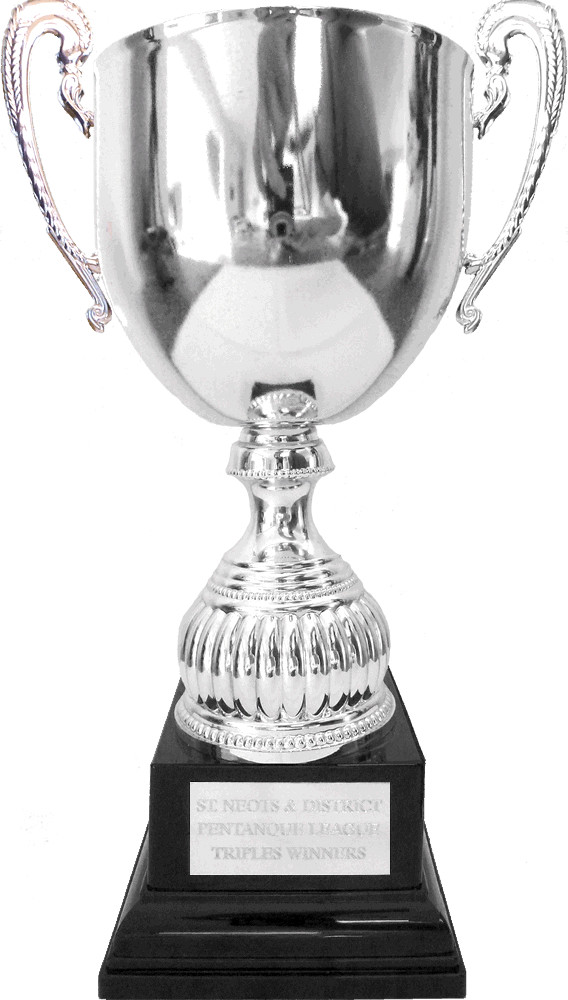 Triples Knockout Trophy


WINNERS
Alison Lesley Owen, Neil Stubbs & Phil Wayles
Crown
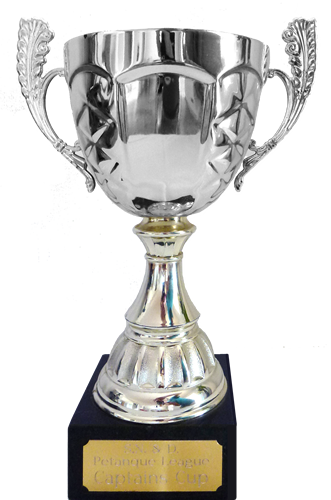 Captains Cup

WINNER
Dave Sellick
Anchor
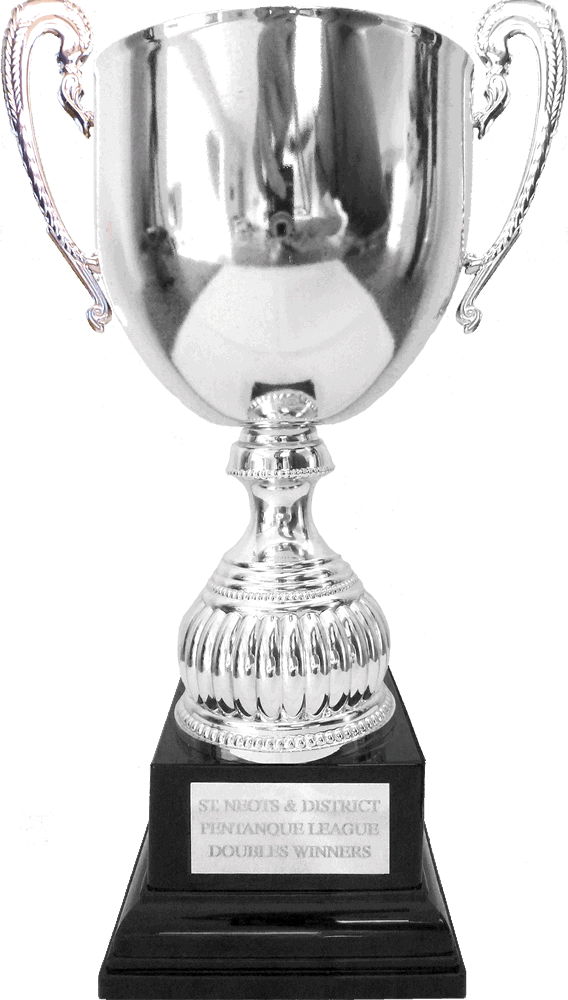 Doubles Knockout Trophy


WINNERS
Matt Warren & Mark Underwood
North Buckden Badgers
